| Published: | |
| Updated: |
I created this page because I noticed two things on Sunday, 22 March 2020:
I'm not sure why they took that figure away, but as long as "total cases" only goes up, showing all known active, recovered, and deceased cases put together, then we can still derive "new cases" for each reporting day.
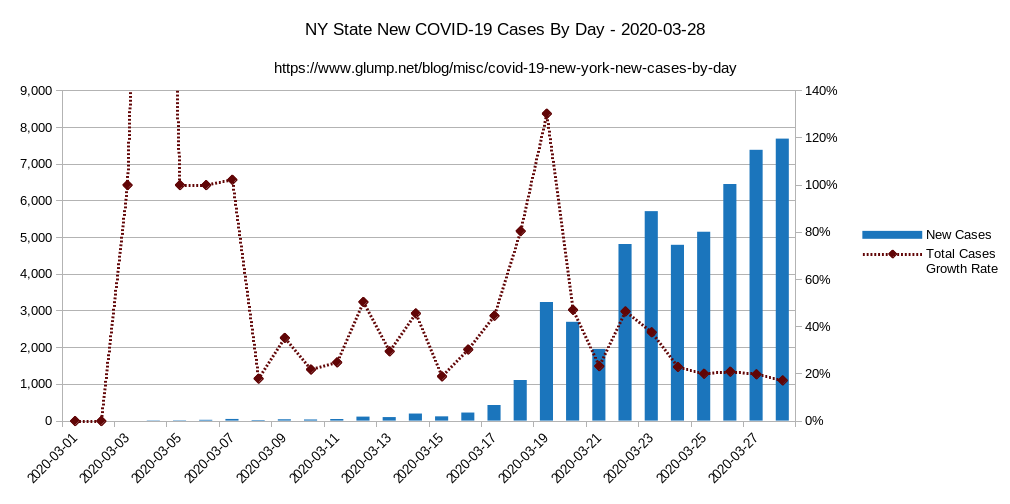
I found a good table of New York State total cases and delta each day in Wikipedia so I made a chart.
I'll try to keep this page updated every day for a while. If old numbers change on future days, watch the change log for comments.
Note, "new cases" jumped up again Sunday. Second wave already here? First wave not done? I have no further comment. Don't draw conclusions from any of this unless you know what you're doing!
(Added 25 March 2020) This page is probably more useful: CoVID 19 Worldwide Growth Rates
covid-19-new-cases-by-day-new-york_2020-03-28.ods
2020-03-22 22:08: Initial release. Pulled data from 2020 coronavirus pandemic in New York (state) on Wikipedia at 2020-03-22 15:35 local time.
2020-03-23 16:31: Same source
2020-03-24 21:19: Added yesterday and today from Wikipedia; the figures don't seem to be updated after they're added for a day during that day. New Cases gone from Wikipedia list; now in my data it's derived from the delta between two days.
This policy contains information about your privacy. By posting, you are declaring that you understand this policy:
This policy is subject to change at any time and without notice.
Reader-contributed comments on Glump.net are owned by their original authors, who reserve all rights.
Comments rules:
Comments (1)
Nobody cares about how many cases there are or the increase in cases if the virus varient is not causing disease. If anything, that would be good news.